Quality criteria for optical images
Explanations of the MTF graphs shown
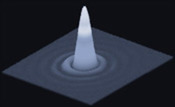
The modulation transfer function (MTF) can be calculated from the two-dimensional curve of the point spread function (PSF) using the mathematical operation of the Fourier transformation. The graph above shows an almost ideal, and therefore rotationally symmetrical PSF (in logarithmic representation of the intensity). The diffraction effects in the edge area can be clearly recognized as small concentric rings, the so-called Airy rings.

Accordingly, the resulting MTF is also a two-dimensional curve. As can be seen from the diagram above, in the case of an ideal image this is also rotationally symmetrical around its central maximum. However, real MTFs do not show the almost linear increase in the flanks that can be seen, nor do they exhibit perfect rotational symmetry. (A violation of symmetry can be caused, for example, by toric (cylinder) parts of the surface).
Usually, only a section from the center to the edge of the MTF is used for simplified representation. This results in the familiar one-dimensional curve (similar to the diagram below). However, if the rotational symmetry is violated, this representation inevitably leads to considerable errors, as only an arbitrary section through the no longer rotationally symmetrical structure is evaluated.

The MTF curves shown here are therefore averaged over a large number of such sections, which always start from the center at different angles. The diagram above illustrates this procedure (view from above of the rotationally symmetrical ideal MTF; the radial lines show the section planes used). For each spatial frequency, which is proportional to the distance of the measuring point from the center, mean, minimum and maximum values can now be determined. These values are also compared with the ideal MTF of the corresponding ideal diffraction-limited lens.
Accordingly, the MTF graphs listed here each show the following four curves:
- dashed (top) curve:
ideal MTF of the corresponding diffraction-limited lens - upper thin solid curve:
maximum modulation values of the MTF - thick solid (middle) curve:
mean modulation values of the MTF - Lower thin solid curve:
minimum modulation values of the MTF
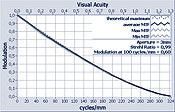
The graph shows an almost ideal MTF in the representation just described. All three measurement curves (solid lines) are almost identical to the curve of the ideal lens (dashed line).
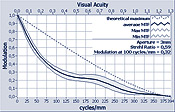
The upper graph, on the other hand, shows an MTF with significant imaging errors. A clear deviation from the ideal and a clear asymmetry (wide gray area between minimum and maximum curve) can be seen here. In addition, spherical aberrations can be observed, which are usually noticeable as a reversal point (or a peak) at the beginning of the lower half of the MTF curve.
In order to facilitate the comparison of the described measurement results between different IOLs, different quality measures are introduced, which summarize the shape of the measured MFT and thus the image quality in a numerical value that is easy to interpret. The two most common quality criteria are explained below: the ISO criterion according to EN/ISO 11979-2 and the so-called Strehl ratio.
ISO criterion
The international industry standard according to EN/ISO 11979-2 [ISO11979] specifies, among other things, the test setup for measuring the imaging quality. In addition, a quality criterion (hereinafter referred to as ISO criterion) is defined.
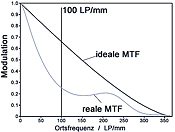
EN/ISO 11979-2 requires a modulation of the MTF of better than 0.43 at a spatial frequency of 100 line pairs/mm with an effective aperture on the IOL of 3mm diameter for all intraocular lenses (IOL). If the design used does not allow this (e.g. spherical IOL with high refractive power), the modulation at 100 line pairs/mm must be above 70% of the theoretically possible value according to the design. In no case, however, may the modulation at 100 line pairs/mm be below a value of 0.28. The graph above illustrates this criterion using the example of an ideal and a real MTF with a large spherical aberration.
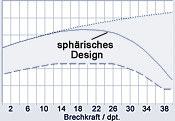
The graph above shows the modulation of the MTF at a spatial frequency of 100 line pairs/mm and an effective aperture of 3mm diameter as a function of the refractive power in diopters (dpt.). The upper dotted line shows the ideal, diffraction-limited design and thus the theoretically maximum possible imaging quality. The dashed line at the lower end of the gray area indicates the minimum requirement according to ISO. The solid line in the middle of the gray area shows the reference design according to ISO (symmetrical spherical biconvex lens).
It can be clearly seen that with an aperture of 3 mm diameter, the value of the modulation at a fixed spatial frequency of, for example, 100 line pairs/mm of the ideal diffraction-limited design (dashed curve) increases with increasing refractive power. The modulation of the MTF of lenses with aberrations such as the symmetrically sparse ISO reference design (solid line), on the other hand, collapses drastically above a certain spatial frequency. For the example of the ISO reference design with a refractive index of 1.46 (acrylate) and an aperture of 3mm diameter, this means almost ideal modulation values up to a refractive power of approx. 15dpt. The modulation then remains largely constant up to approx. 25dpt. and collapses drastically above 25dpt. This drop is due to spherical aberration and corresponds to a significant loss of contrast in the perceived image.
As can be seen in the figure above, the ISO criterion is strongly dependent on the refractive power of the measured IOL. To enable comparability of the ISO criterion across different refractive powers, we therefore also state the relative ISO criterion as a percentage (referred to here as ISO% ). The ISO% value indicates the comparison of the ISO criterion to the ideal, diffraction-limited lens. An ISO% value of 100% would therefore correspond to the ideal, diffraction-limited lens, regardless of the refractive power of the measured IOL.
Strehl ratio (Strehl ratio)
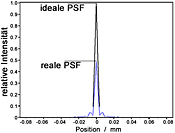
The Strehl ratio (SR) is a measure of the imaging quality of an optical system over its entire spatial frequency range compared to the corresponding ideal (diffraction-limited) system [Hecht98]. The Strehl ratio can be calculated in two different ways:
Firstly, by dividing the measured maximum of the PSF by the maximum of the determined ideal PSF. However, this measurement is comparatively inaccurate due to the comparatively high noise of this value in the real measuring system.
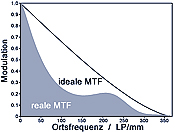
On the other hand, the beam ratio can also be determined from the volume below the two-dimensional measured MTF divided by the volume below the ideal MTF. As noise effects have less of an impact on the measurement result with this method due to the high averaging, this measurement method is also generally more precise.
The resulting numerical value between 0 and 1 is also a measure of how much energy is scattered from the center of the spot (focus point) into the surrounding areas. For this reason, this measurement variant is ideal for precisely measuring bifocal or multifocal IOLs, for example.
An ideal lens has a Strehl ratio of 1.00. The lower this numerical value, the poorer the overall image quality of the lens (or system) tested.
Contact
Prof. Dr. rer.nat. Wilhelm Stork,
Tel. 0721 / 608 - 2510, wilhelm.stork∂kit.edu

